[ad_1]
With the summer rally in stocks seemingly on hold as investors wait to hear from Federal Reserve Chairman Jerome Powell on Friday, one technical strategist has put together a list of ‘pros and cons’ that could help investors clarify their thinking about where the market is headed next.
John Kosar, chief market strategist at Asbury Research, said his firm’s quantitative model for stocks suggests that the “tactical,” or near-term, uptrend for the S&P 500
SPX,
still has some room to run.
However, Asbury Research ultimately expects selling to continue over the long term, as the bearish trend in stocks that began in January remains intact, even if it has been tested by the summery rally, according to a Tuesday note to clients.
According to Kosar, it would take Wall Street’s “fear gauge,” the Cboe Volatility Index,
VIX,
making a sustained run back above 24 to indicate that this week’s pullback in stocks has legs. Until that happens, Kosar said there still are some compelling metrics, including investor sentiment, market breadth, and others, to suggest that stocks won’t immediately return to the June lows.
See: The Dow usually slumps in September. The reason why is one of the market’s unsolved mysteries
But there are other factors, most notably investor positioning and seasonality, that suggest the recent pullback could continue.
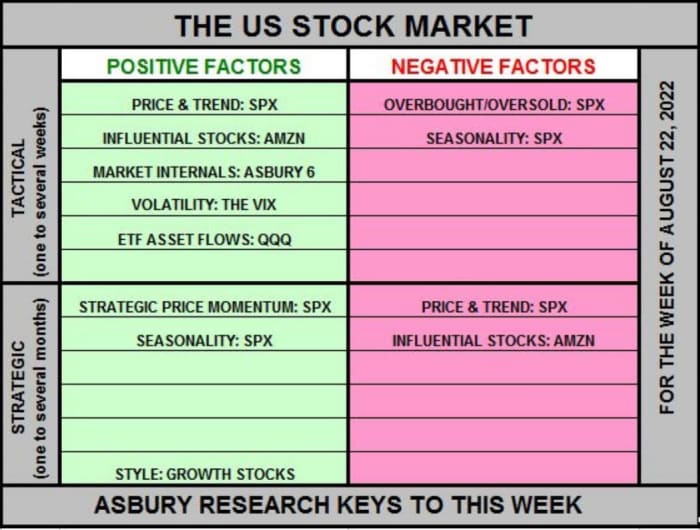
Kosar breaks down these into “tactical” factors, or those likely to play out in the coming weeks, and others that are “strategic,” likely to occur in coming months.

Source: Asbury Research
More details on each of these factors can be found below:
- Price and trend (near-term bullish, intermediate-term bearish): Despite the sharp decline that started at the end of last week, the S&P 500 still is in a minor tactical uptrend. This trend will remain intact until the S&P 500 tumbles back below 3,946, according to Kosar.
-
Movement in influential stocks (near-term bullish, intermediate-term bearish): Like the S&P 500, Amazon.com Inc.,
AMZN,
+0.45%
the fourth-largest U.S. stock by market capitalization, recently bounced off an important resistance level (in both cases, the resistance was the 200-day moving average). Whether Amazon breaks above this resistance level, or heads lower first, could have major implications for both Amazon shares, as well as the broader market. - Market internals point higher (near-term bullish): Asbury’s “A6” model of market internals remains biased in favor of further gains for stocks. This model is based on six factors: the rate of change in the S&P 500, relative performance in stocks and high-yield bonds, asset flows into U.S. stocks and stock funds, corporate-bond spreads, trading volume and market breadth.
- Volatility (near-term bullish): As mentioned earlier, Asbury views a VIX of at least 24 as the line of demarcation between a tactical buying opportunity in the S&P 500 and a sustainable market decline. The VIX was pegged at 23.67 Tuesday, up nearly 15% on the week so far.
-
Asset flows (near-term bullish): Unlike most of the earlier factors, this one relies on the Nasdaq-100 via the Invesco QQQ exchange-traded fund
QQQ,
+0.09% .
According to Asbury, net assets flowing into the popular exchange-traded fund have been above their 21-day moving average since July 6. It would take a decline in these assets back below their 21-day moving average to suggest that the recent pullback in the index has legs. - Overbought vs. oversold (near-term bearish): The S&P 500 appears to be pulling back from what Kosar described as “monthly overbought extremes.” Similar patterns emerged in the previous, three minor market tops that have occurred since December. Could this be the fourth?
- Market breadth (intermediate-term bullish): The percentage of New York Stock Exchange stocks that are trading above their 200-day moving average is back above 40% from a near-term low of just 18% from July 1. Strong market breadth bodes well for stocks, Kosar said.
- Strategic price momentum (intermediate-term bullish): The S&P 500’s 13-week rate-of-change has edged back above the zero line as of Aug. 5. But this line is presently being tested. If it holds, it could indicate that the market won’t return to the June lows soon.
- Seasonality (near-term bearish, intermediate-term bullish): Historical market data show the first two weeks of July are typically the two strongest weeks of the entire third quarter for the S&P 500, based on data since 1957. Following this, the index often gradually weakens heading into September.
- Growth vs. value (near-term bullish): Simply put, growth stocks that are also members of the S&P 500 have been outperforming value stocks in the S&P 500 since the recent market uptrend began. This is indicative of improving risk appetite, which typically bodes well for stocks.
To be sure, technical analysis can be more art than science, and there’s plenty of room for disagreement. Professor Jeff Bierman, chief market technician at TheoTrade, said the market flashed a rare bearish signal on Friday when three popular technical indicators — the moving average convergence-divergence gauge, the relative strength index and the slow stochastic oscillator — all flashed bearish signals simultaneously.
As of Tuesday, the Dow Jones Industrial Average
DJIA,
was on track for a third day of declines, although the S&P 500 was roughly flat and the Nasdaq Composite
COMP,
was up 0.2% at last check. All three indexes posted their biggest daily drop in two months on Monday.
[ad_2]